A number of people have asked me how to use the Grafio App, so I made a screencast. I hope you find it useful! Cheers!
Read More
Infographics made, easier? Well - as you know I'm a big fan of representing information beautifully. It makes what you're trying to explain easier to understand rather than looking at a massive bank of numbers. Representing data in this way, truly is turning it in to information - something ICT…
Read More
This post is really an update following my recent posts about Twitter and the ideas gained through sharing my tweets with others. For a much longer write up, this post by Jon Tait inspects the experience in more detail really well here: http://www.woodham.org.uk/edutait/ The original post has had more than 1000…
Read More
Inspired by my previous post about collaboration across Twitter, Jon (@TeamTait) Tait has been busy again with a new infographic on the topic:
Read More
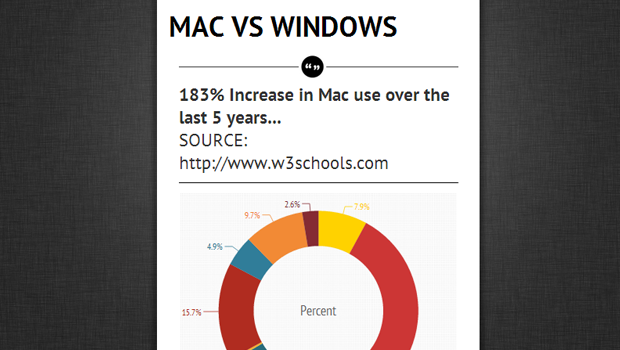
Thanks to the wonderful blog of Laura Knight (@elearninglaura) http://www.elearninglaura.net/ I stumbled across the brilliant tool - PiktoChart where you can easily make your own cool infographics. The best thing is that you can create some cool infographics in the easy to use UI really easily and for free. Okay, for some…
Read More